


The table below shows the inflation rate for an economy between 2012 and 2015.
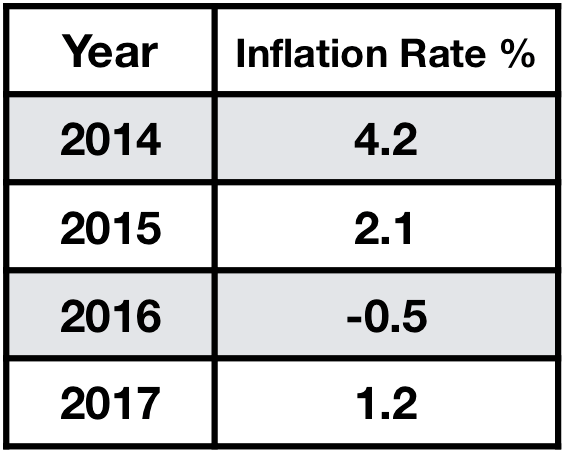
What can be concluded from the information?
Select ONE answer:
- The price level was lowest in 2014.
- The price level was lowest in 2016.
- The economy experienced deflation over the whole period.
- The value of money rose over the whole period.
Show your workings to arrive at your answer, and explain and justify your reasons:……………………………………………………………………………………………………………………………………………………………………………………………………………………………………………………………………………………
This multiple choice question is suitable for Economics KS5 classes.
The answer is 1
- Correct: The price level rose over the period 2014 to 2017 and so it was at its lowest in 2014.
- The price level did fall in 2016 but it was still higher than in 2014.
- The economy experienced deflation in 2016 but over the period the price level rose.
- The value of money fell over the period as the price level rose.

This work is licensed under a Creative Commons Attribution 4.0 International License.
