


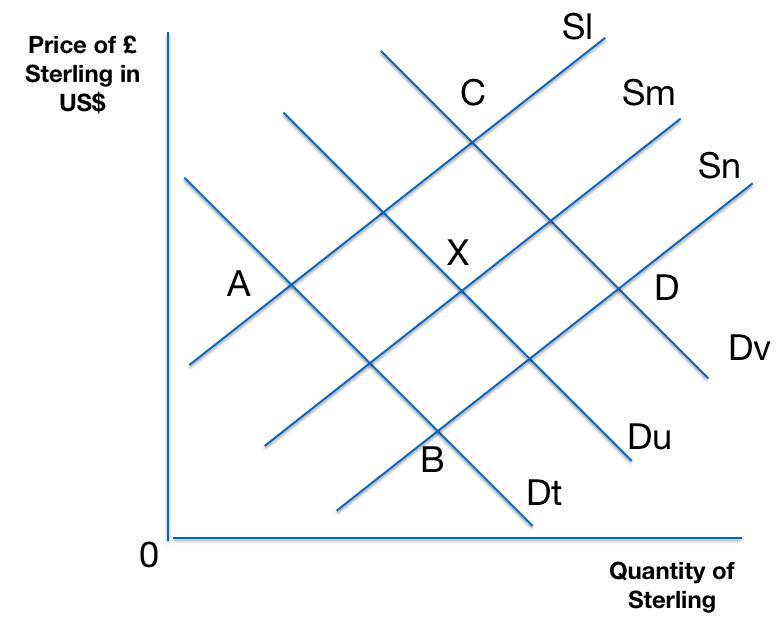
The diagram below shows three supply curves (labelled S) and three demand curves (labelled D) for the pound sterling (£). The price of sterling is quoted in US$. The original equilibrium is at point X.
There is now a recession in the USA. At the same time, the UK is experiencing a consumer boom.
Which point A, B, C or D will represent the new equilibrium in the market for the pound sterling?
Select ONE answer:
- A
- B
- C
- D
Show your workings to arrive at your answer, and explain and justify your reasons:……………………………………………………………………………………………………………………………………………………………………………………………………………………………………………………………………………………
This multiple choice question is suitable for Economics KS5 classes.
The answer is 2
- This shows a decrease in supply and a decrease in demand for pounds sterling.
- Correct: A recession in the USA will reduce demand for UK exports and so the demand for pounds sterling. A consumer boom will increase demand for US imports and to purchase these the supply of pounds sterling will increase.
- This shows a decrease in supply and an increase in demand for pounds sterling.
- This shows an increase in supply but also an increase in demand for pounds sterling.

This work is licensed under a Creative Commons Attribution 4.0 International License.
