


The diagram below shows a change in a country’s macro-equilibrium price level and real GDP.
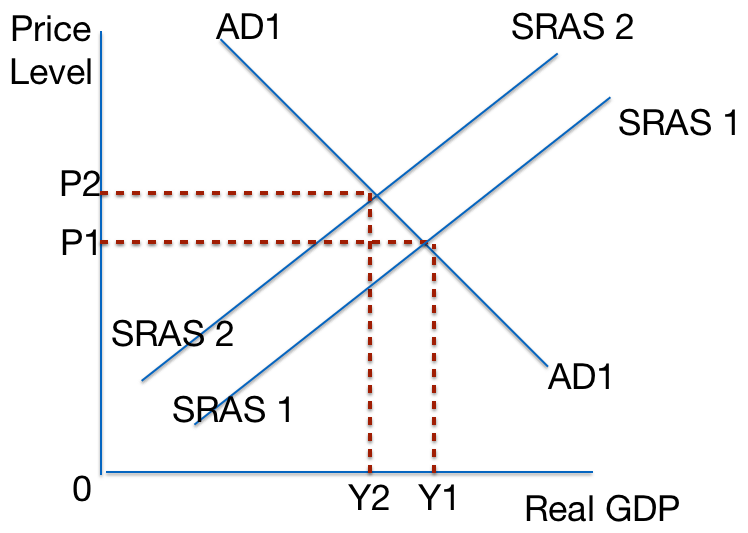
Which of the following might have caused this change?
Select ONE answer:
- a decrease in business taxes, not matched by a cut in government spending
- a decrease in raw material costs, not matched by an increase in corporate taxes
- an increase in exports, not matched by an increase in imports
- an increase in wages, not matched by an increase in labour productivity
Show your workings to arrive at your answer, and explain and justify your reasons:……………………………………………………………………………………………………………………………………………………………………………………………………………………………………………………………………………………
This multiple choice question is suitable for Economics KS5 classes.
The answer is 4
- This would cause an increase in SRAS – a shift to the right of the SRAS curve.
- This would cause an increase in SRAS – a shift to the right of the SRAS curve.
- This would cause an increase in AD – a shift to the right of the AD curve.
- Correct: This would increase costs of production and so cause a shift to the left of the AS curve.

This work is licensed under a Creative Commons Attribution 4.0 International License.

You must be logged in to post a comment.