


The table shows an extract from a company’s accounts for the year ended 31 December 2019.
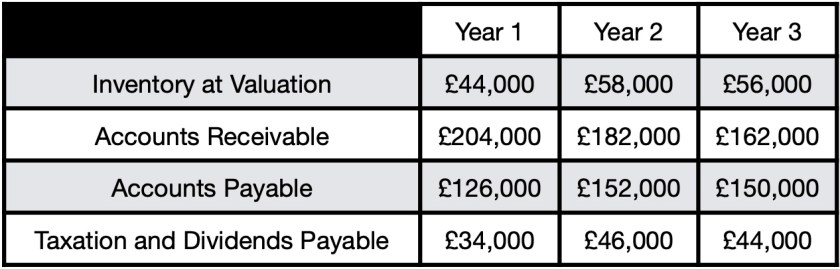
What do these figures show about the company’s liquidity?
Select ONE answer:
- It declined in year 2, but no further in year 3.
- It declined in year 2, but then improved in year 3.
- It has continually declined over the 3 years.
- It has continually improved over the 3 years.
Show your workings to arrive at your answer, and explain and justify your reasons:
……………………………………………………………………………………………………………………………………………………………………………………………………………………………………………………………………………………
This multiple-choice question is suitable for Accounting KS5 classes.
The answer is 3
- Not correct
- Not correct
- Correct – Year 1 (£44k + £204k / £126k + £34k) = 1.55, Year 2 (£58k + £182k / £152k + £46k) = 1.21, Year 3 (£56k + £162k / £150k + £44k) = 1.12
- Not correct

This work is licensed under a Creative Commons Attribution 4.0 International License.
