


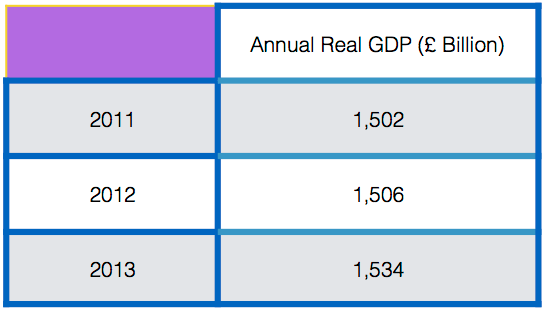
The table below shows UK annual real GDP values for 2011–2013.
Which ONE of the following can be inferred from the table?
Select ONE answer:
- Real GDP was falling between 2012 and 2013
- The annual UK economic growth rate for 2012 was negative
- Nominal GDP was falling between 2012 and 2013
- The annual UK economic growth rate for 2012 was positive
- Real GDP was lower in 2014 than in 2012
Calculate the annual UK economic growth rate for 2013 from the table above. You are advised to show your workings:
……………………………………………………………………………………………………………………………………………………………………………………………………………………………………………………………………………………
This is multiple choice question is suitable for Economics KS5 classes.
The answer is 4 – 2012 Real GP was £1,506 Billion and £1,502 Billion in 2011, an increase of 0.3%

This work is licensed under a Creative Commons Attribution 4.0 International License.

You must be logged in to post a comment.